
Why Energy Audits Matter for Indian Manufacturers
Electricity is one of the top three operating costs for most Indian manufacturing plants, alongside raw materials and labour. With industrial tariffs ranging from ₹7 to ₹12 per kWh depending on the state and sanctioned load, a medium-sized plant consuming 5,00,000 kWh per month spends ₹35–60 lakh annually on electricity alone. A systematic energy audit typically identifies 10–25% reduction potential, translating to savings of ₹4–15 lakh per year — with many measures paying back within 12–18 months.
Beyond cost savings, the Bureau of Energy Efficiency (BEE) under the Ministry of Power mandates energy audits for designated consumers (DCs) under the Energy Conservation Act. Plants above the threshold must appoint a certified energy auditor and submit annual reports. Even plants below the mandatory threshold benefit from voluntary audits as a competitive advantage.
Step 1: Pre-Audit Data Collection
Before the audit team enters the plant, collect 12 months of electricity bills to establish a baseline. Key metrics to extract:
- Monthly consumption in kWh and maximum demand in kVA/kW
- Power factor recorded by the utility (penalty if below 0.95 in most states)
- Time-of-use data if available from smart meters
- Peak demand windows and their duration
- Specific Energy Consumption (SEC): kWh per unit of production
Also gather plant production records for the same 12 months so you can calculate SEC and identify if high consumption months correlate with high production or with seasonal factors like ambient temperature affecting HVAC and cooling systems.
Create a single-line diagram of the main electrical distribution and list all significant loads: motors (by kW rating and operating hours), lighting, HVAC, compressors, furnaces, and any process heating equipment.
Step 2: Walkthrough Audit and Measurement
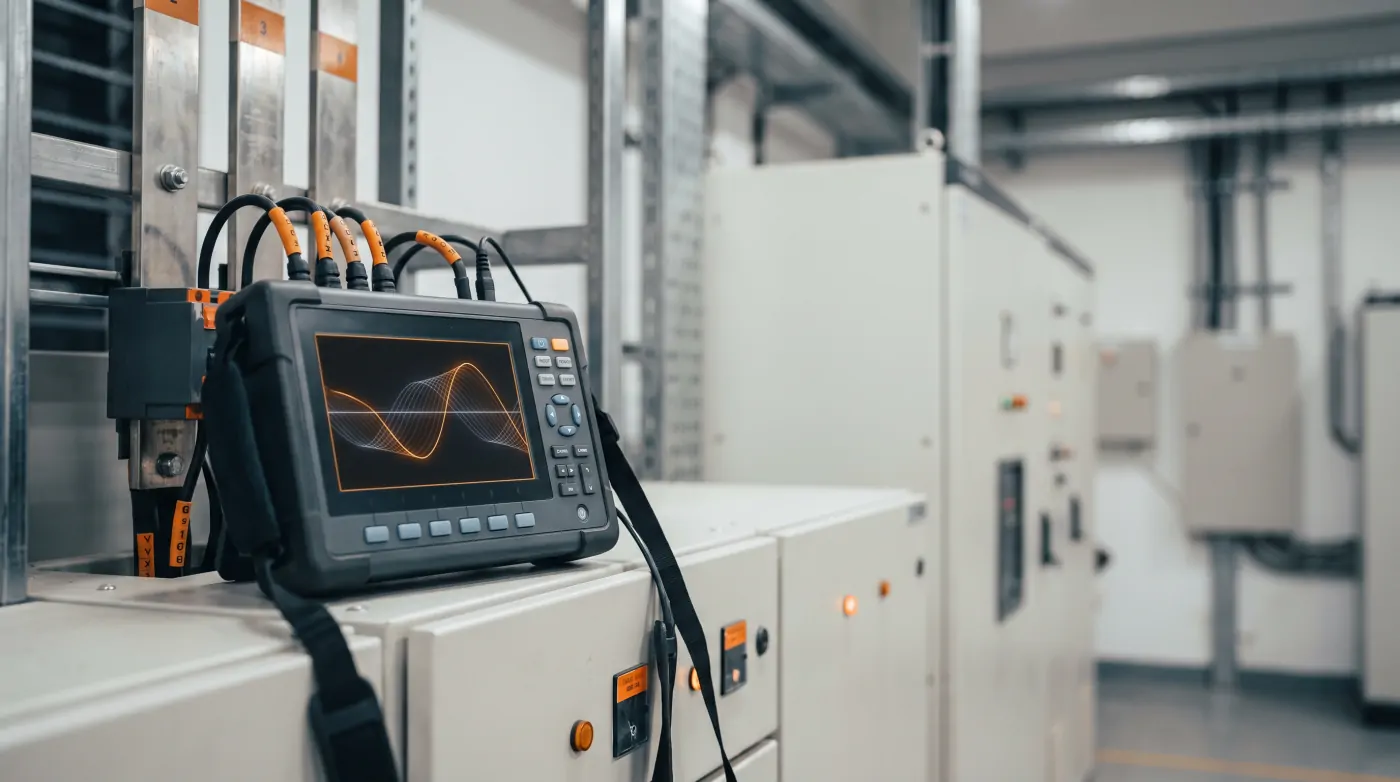
The walkthrough audit involves physically inspecting all energy-consuming systems with portable measurement instruments. The audit team should carry:
- Power analyser / power quality analyser (Hioki, Fluke, or equivalent)
- Clamp-on ammeter and true RMS voltmeter
- Lux meter for lighting assessment
- Infrared thermometer and thermal camera for hot spots
- Ultrasonic leak detector for compressed air
Motor systems: Measure actual running current and compare to nameplate FLC. Motors running below 40% of rated load are candidates for right-sizing or VFD installation. Log operating hours to calculate annual consumption.
Compressed air: Compressed air leaks are the most common and easiest-to-fix waste in Indian plants. An ultrasonic detector can find leaks in joints, valves, and hoses. A single 3 mm leak at 7 bar costs approximately ₹80,000–₹1,20,000 per year in wasted compressor energy.
Lighting: Measure lux levels in all work areas. Compare against IS 3646 (Indian standard for industrial lighting). Identify areas where lights are on during non-working hours. Calculate the saving from LED retrofits or occupancy sensor installation.
Power factor: Download the power factor log from the meter or main APFC panel. Sustained power factor below 0.92 indicates reactive power compensation needs upgrade. Low power factor increases kVA demand charges even if kWh consumption is acceptable.
Step 3: Identify and Prioritise Opportunities
After data collection and measurement, the audit team compiles a list of energy conservation measures (ECMs). A typical Indian manufacturing plant audit reveals:
| Measure | Typical Saving | Simple Payback |
|---|---|---|
| VFD on pump/fan motors | 20–50% of motor energy | 12–24 months |
| Compressed air leak repair | 15–30% of compressor energy | 0–3 months |
| LED lighting retrofit | 50–70% of lighting energy | 18–30 months |
| APFC panel upgrade | Demand charge reduction | 12–24 months |
| Motor right-sizing | 5–15% of motor energy | 24–48 months |
| Insulation improvement on steam/hot lines | 10–20% of heat energy | 12–24 months |
Prioritise measures by simple payback period and ease of implementation. Quick wins (payback under 12 months) with minimal disruption to production should be implemented first to generate savings that fund longer-payback improvements.
Step 4: Calculate ROI and Prepare the Business Case
For each major ECM, prepare a simple financial model:
- Annual saving (₹) = Energy saving (kWh/year) × tariff rate (₹/kWh) + demand charge saving
- Implementation cost (₹) = Equipment + installation + commissioning
- Simple payback (years) = Implementation cost ÷ Annual saving
- Net Present Value (NPV) over 5 years at 12% discount rate
Present findings to management with a traffic-light priority matrix. Green = payback under 18 months, Amber = 18–36 months, Red = over 36 months. Typically 60–70% of identified savings fall in the green category.
Step 5: Implement and Verify Savings
Implementation without verification is incomplete. After each ECM is installed, re-measure to confirm the expected saving is being achieved. Install sub-metering on major systems (compressors, HVAC, process heating) if not already present — sub-meters provide the baseline data needed to verify savings and are essential for the next audit cycle.
For VFD installations, read the VFD energy counter before and after installation on the same load cycle to confirm percentage saving. For compressed air leak repairs, compare compressor running hours per unit of production before and after repair.
Document all findings, measurements, and verified savings in a formal audit report. This report is required for BEE-designated consumers and serves as a reference baseline for the next audit.
Continuous Monitoring After the Audit
A one-time audit captures a snapshot. The real value comes from implementing continuous energy monitoring using energy management software or an industrial IoT platform. Real-time energy dashboards allow shift supervisors and plant managers to see consumption trends, identify deviations from baseline, and act before the electricity bill arrives.
Modern energy monitoring systems can integrate with your existing SCADA infrastructure or operate as a standalone cloud-based system with data loggers on each distribution circuit.
Further Reading
Related Articles
Explore more technical guides from our automation knowledge base.